
External display support
One of the strengths of AIDA64 has been providing users with precise and abundant hardware monitoring information. The software offers several ways to visualize sensor data, such as clock rates, temperatures, voltages, fan speeds etc. For the past few months we have been working hard to give you even more opportunities for displaying such info: we've been adding support for a huge number of external displays, VFDs (vacuum fluorescent display), LCDs and even OLEDs.
Using such devices can come in handy when you want to keep an eye on hardware related information at all times, even when watching a movie or playing a game in full screen. Now AIDA64 can send information to external displays directly, without the need to use third-party applications. And you can select and edit what and how you want to show on these displays, right from AIDA64.
The latest stable already supports dozens of displays, and the number is constantly growing as our developers are working hard to implement support for even the most exotic panels you guys may be using. Your feedback is welcome here: if you happen to use displays that AIDA64 does not support yet, please let us know in the forums.
LCD support has been designed with power users in mind, users who prefer customizing every single detail in both the layout and the set of displayed values. In this blog post we want to show you how you can create a customized LCD in AIDA64.
Specifically, we are going to describe how you can populate a color LCD with hardware monitoring info as well as some eye-candy. However, AIDA64 supports a couple of less fancy devices as well: if you use alphanumeric displays or monochrome LCDs your options will obviously be more limited. On an alphanumeric device, for example, you can only visualize “Simple sensor items”, that is text, while monochrome LCD can cope with some basic imagery only.
Currently supported LCD models: 4D Systems / Abacom (ExpertProfi) / Acer / Adafruit / AlphaCool / AquaComputer / Art.Lebedev / Asus / Avax / AX206 / BeadaPanel / BitFenix / BWCT / CH424 / Cooler Master / Corsair / Crystalfontz / ct-Mäusekino / Cwlinux / Dangerous Prototypes / Digital Devices / EastRising / Elgato / ELV / EVGA / Futaba / GLCD2USB / Gravitech / HP / IkaLogic / IRTrans / LCD2USB / LCDInfo / LCD Smartie Hardware / LCDsysinfo / Leo Bodnar / Logitech / LPT / Mad Catz / Matrix Orbital / Modding-FAQ / MSI / nMedia / Noteu / Odroid / Pertelian / Phidgets / picoLCD / POS / Pyramid / Razer / RoboPeak / Roccat / Saitek / Samsung / SDC / Shuttle / SmartCool / SoundGraph / SpikenzieLabs / SteelSeries / Sure Electronics / Trefon / Turing / UCSD / USB2LCD+ / VL System / VoCore / VU Dials / Wallbraun / WeAct / Yoctopuce
For details on supported devices, check our LCD Guide (PDF, updated on 01/16/2026).
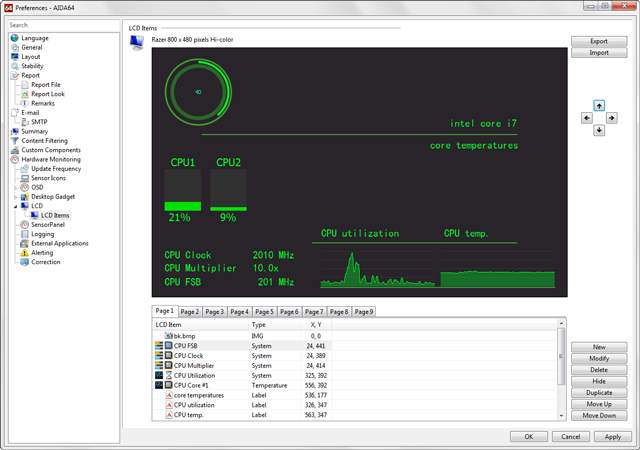
The first step is to enable our external display in AIDA64 by selecting the device in File / Preferences / Hardware Monitoring / LCD.
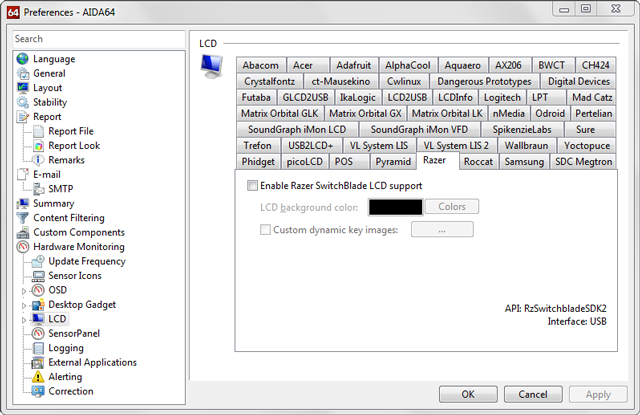
- If you use a color LCD, you have the choice to use either a background color or a custom background image. You can come up with spectacular results both ways. If you go for a solid color background you have to specify the color here. If multiple pages are available on the display, the color selected here will be used on all the pages. If you want a custom background image, you have to upload it in the editor (see step 4 below). The tabs often give you the chance to adjust brightness and/or contrast for monochrome and alphanumeric displays.
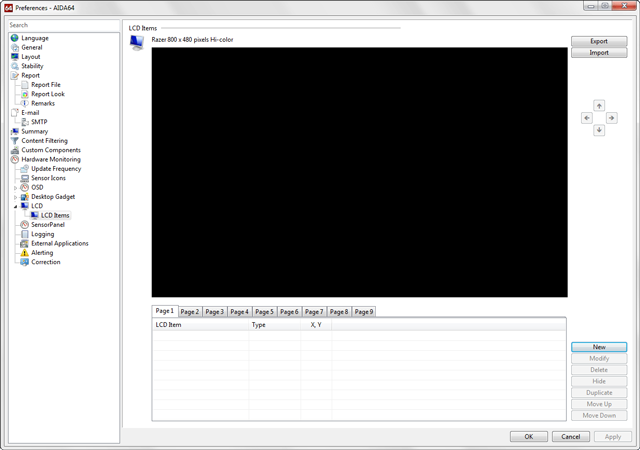
Now let's open the LCD layout editor which is available in File / Preferences / Hardware Monitoring / LCD / LCD Items. What you'll see here is a preview of the external display and the list of items shown on the panel. To those who have already experimented with the SensorPanel the editor will look quite familiar: it's not a coincidence as both work exactly the same way. The only difference is that here you can design more pages for a single device, if the external display can handle multiple pages. You can select each page by clicking on its tab, just like you do in web browsers.
Now let's add a background image to the blank panel. To add an image, click on “New”, then select “Image” from the drop-down menu, browse to the file's location, and click OK. Note that currently BMP, JPG and PNG images are supported.
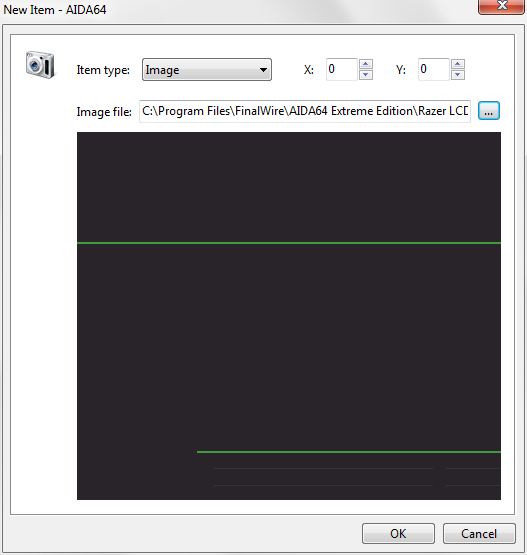
Hint: you can add any image to the display this way, and set its position on the panel by specifying the X and Y coordinate values. But you can also position any item in the layout by selecting it in the item list and using the arrows on the right. We can move items up or down in the list. Items are displayed as layers on the display, and this list determines the order of the layers: the topmost item in the list will be the background layer, the next one the first layer and so on. By default, an item listed under another will cover at least parts of those listed above it if they overlap each other on the panel. Because of that, always make sure to make the background image the topmost item.
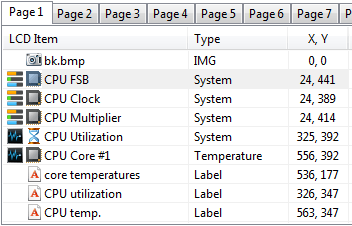
Now we are going to populate the blank screen with sensor items: first, a gauge indicating CPU Utilization. Let's select “New”, then “Gauge” from the “Item type” drop-down menu, then “CPU Utilization” from the list. We can customize the gauge by selecting the size, color, label, font type etc. we want to use.
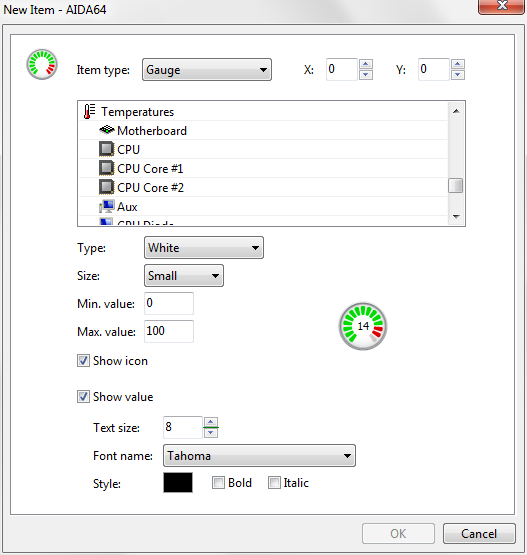
Again: you can position any item on the layout by entering the exact X:Y coordinates on the item settings page, or by selecting it in the list and using the arrows on the right.
Hint: If you are not satisfied with the default gauges, and you are not afraid of using Photoshop or other graphics editors either, feel free to create and use custom gauges. To do this, you fist need to draw all the 15 possible indicator states and upload them one by one in AIDA64 by selecting Custom in the Type menu, and then clicking on the “States” drop-down list. (You can download the default AIDA64 gauge states from here [link]. Feel free to modify them!)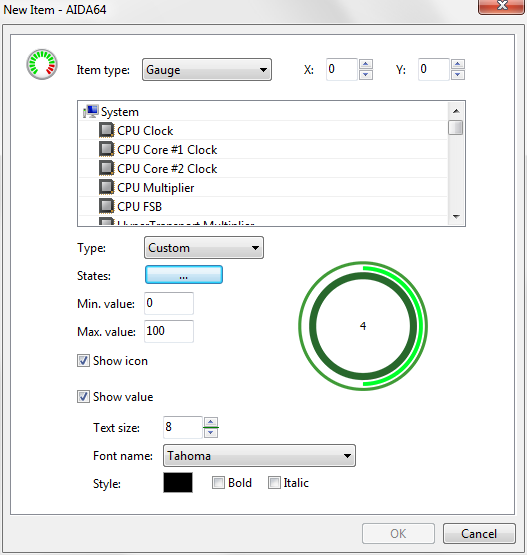
Currently, AIDA64 includes one set of “factory” gauges for color LCDs, and one for monochrome LCDs.
Adding a graph works just like adding a gauge. For example, if you want to display the utilization of CPU Core 1 in a graph, all you need to do is clicking on “New”, then selecting “Graph” from the “Item type” drop-down menu, and then selecting CPU1 Utilization. You may need to set the min and max threshold values for the graph, but in this case the default 0 to 100 range is just fine. You can now position the graph and define its width and height as you wish. There are a couple of other things you can customize, including background color, grid color, graph line color and thickness, label font etc.
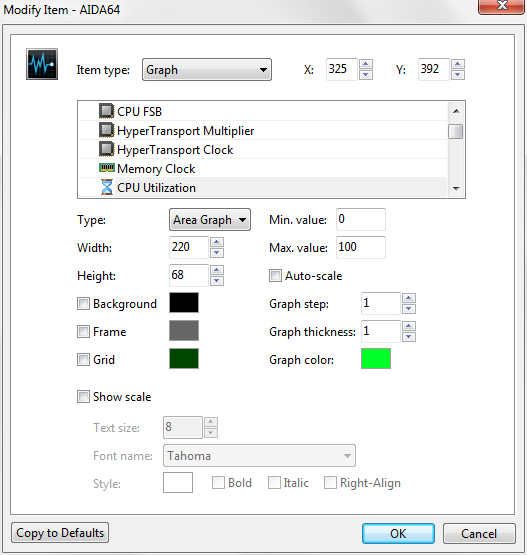
Now, if you want to see all utilization for all CPU cores on the same graph, all you need to do is duplicating the first graph, for example, three times if you have a 4-core CPU, and then modifying the newly created graph items and selecting the appropriate CPU core for each (eg. CPU2 utilization for the 2nd item and so on...). Make sure to uncheck the graph background on the stacked items, otherwise they will overlap and the topmost item will cover the others. Also, if you need the grid in the graph, turn it on for the first item only, and turn it off for each newly added item to avoid wasting computing resources on rendering redundant visuals.
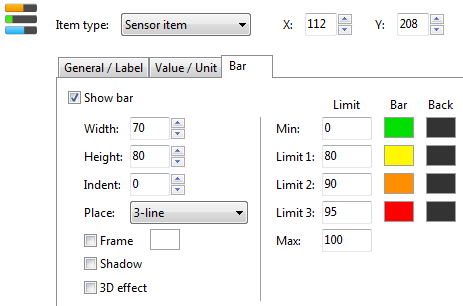
The same way, you can add further items, like further graphs, bars, text and images to the panel. There are a couple of options available for each: for example, you can set the min and max values for each item. Or you can set the values when the color of the bar should change, eg. from green to yellow and then to red as the CPU or GPU is getting hotter. In the latter case, bear in mind that you need to set the bar color-coding thresholds so that they match the characteristics of the monitored hardware as 60 Celsius may be absolutely normal for a GPU, while too high for a HDD.
Hint: if you want to use more sensor items of the same kind (gauge, graph), customize the first and then duplicate it (Duplicate) as many times as required.
Hint: you can modify the settings for multiple items at once if you select more items and click on “Modify”. If you do so all modifications will be marked with a vertical red line in the settings window. You select multiple items in the list the usual way: to select a consecutive group of items, click the first item, then press and hold down the Shift key while making the selection. To select non- consecutive items (ie. ones not next to each other), hold down the Ctrl key and click each item that you want to select. On devices that support multiple pages, you can even copy all the items on a page, and paste them to another page. Hint: You can also display whatever labels you want for each sensor item. It's recommended to change the default label which is usually too dull and too long. :) You can even delete the labels, which may come in handy on low-resolution alphanumeric LCDs where each pixel counts.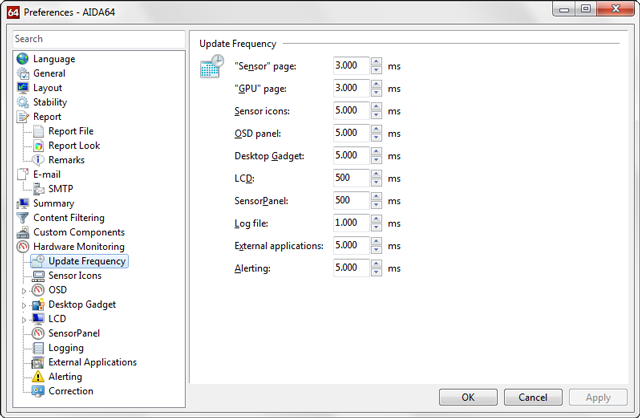
In the Preferences / Hardware Monitoring / Update Frequency menu, you can set how often AIDA64 Extreme updates the sensor readings on the LCD. Currently, the lowest selectable refresh rate is 500 ms.
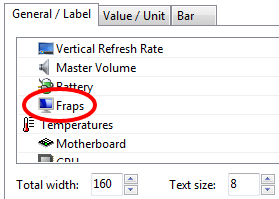
Bonus: Even though AIDA64 cannot measure FPS in games, with a little help from a friend it can show FPS info on external displays. You need to install and run FRAPS to make this happen. When FRAPS is running, it will appear among the available sensor items.
You can download and try latest AIDA64 version from the Downloads page or you can purchase a license in our Online Store.